
Scientific Methods

Science Process
Tech Design
|
Scientific Methods |
Science Process |
Tech Design |
|
Data & Measurement
|
|
Vocabulary Review Activities:
(play them early and often!)
BrainPop Animations and Practice Quizes |
Vocabulary Science Skills Handbook 1999 -Graphing Appendix: Pages 202-214: What Is Science 1994 Measurement with theMetric System 1994: Chapter 2 Sections 1 & 2 Pages 38-61 Mathematics In Science Summary & Adapted Reading Worksheet Graphs In Science Summary & Adapted Reading Worksheet Scientists on the Cutting Edge Booklet Process Skills Packet |
| Labs & Videos |
 Penny Observation Pre-Lab Worksheet Link PennyPrediction Pre-Lab Worksheet Link |
Hooda Math Graphing Gala Coordinate Game InteractiveSites.weebly Graphing Interactive Links |
BBC Bitesize Math Mean, Median, Mode, Range Frequency Diagrams Tables and Lists Graphs |
|
 Measure the Golden Center and other Quantitative Activities |
NCTM Illuminations | |
|
SAS Curriculum Pathways |
Study Jams Animations and Practice |
Gizmos |
Nye Measurement Video Espanol Measurement Quiz
|
|
IXL Math
|
IXL Math
|
|
| Essential Vocabulary & Concepts |
| Picture | Core Knowledge or
Concept |
| Quantitative observations measure using numbers. | |
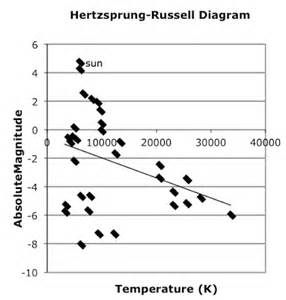
Scatter Plot with Line of Best Fit |
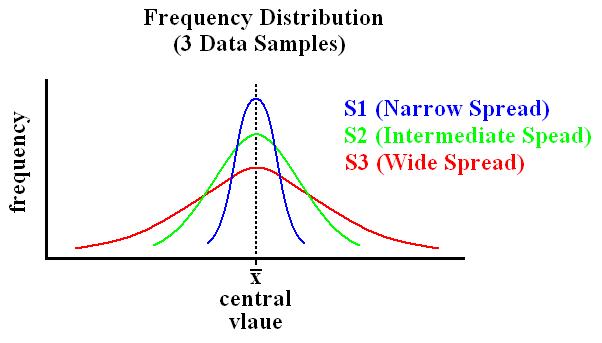
Data Spread and Range measures how much
variability is in a data set Spread is how much the data varies in value Range = highest value - lowest value. i.e. for the set {35, 44, 73, 85} 85-35 = 50 Range is often used to set up the scale of a graph using these values : maxima : the highest value minima : the lowest value |
|
Frequency Distribution - another way to
look at
spread related to
|
 |
Measures of Central
Tendency Mean - (most often used in data analysis) the sum of the values divided by the number of values. i.e. for the set {1,2,3,4,5} (1+2+3+4+5) / 5 = 15 / 5 = 3 is the average Median - the middle value in an ordered set i.e. in the set {1,2,3,4,5}, 3 is the middle value Mode - the most frequent value in a data set. i.e. in the set {1,1,1,2,2,3}, 1 occurs most often. |
 |
Variables: The three types are:
|
 Click on image |
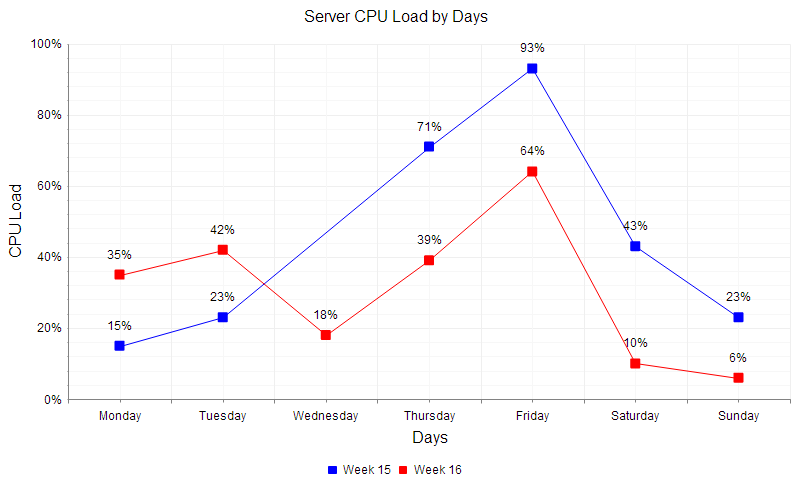
Scatterplots and Line Graphs
(2-dimensions) These coordinate plane graphs show pairs of data
representing the Independent variable on the x-axis and the dependent
variable on the y-axis
|
|
|
Bar Graphs These coordinate plane graphs
show categorized data as bars for comparison. May be horizontal or
vertical.
|
|
Pie Charts or Circle Graphs
show categorized data as arc sections (slices from the center) for
comparison to the whole.
|
|
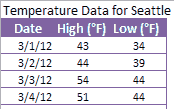
Data Tables show data as numbers, often
organized to show relationships (x,y pairs, etc.) often ordered by
independent variable.
|
|
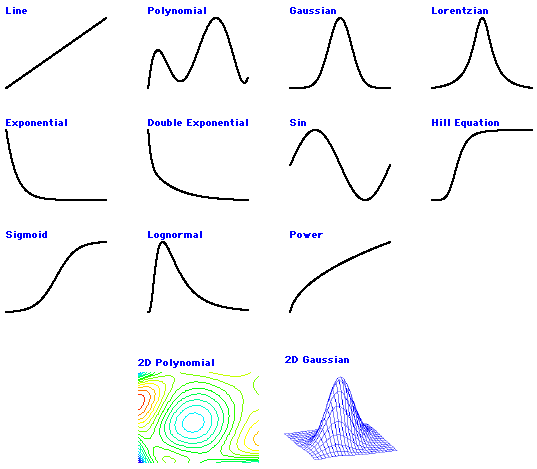
Data Trends
Line of Best Fit - A mathematical process (usually with Excel) to find a line that fits the data. Used to find a correlation between independent and dependent values.
|
 |
Metric System (International
System of Units, SI) a system of measurement based on the number 10.
|
| Other Graphs Box and Whisker Pictograph Stem and Leaf |
|
 Textbook
 Summary
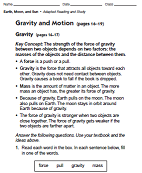 AdptdRdg
 Measurement Exercises
 Data Games & Activities: Averages & Graphing